A sample size calculator solves this by estimating how many interactions you need to review to make a defensible statement about call quality. But the right number isn't universal. It depends on your objective, your population, your confidence level, your margin of error, and how you select calls in the first place.
This guide walks through how to calculate that sample, how to pick calls that actually represent your population, why the "30 calls" rule gets misapplied, and when manual sampling stops being enough.
Key Takeaways
- A statistically sound QA sample isn't automatically right for coaching, compliance, or catching rare events.
- Calculator inputs matter: population, confidence level, margin of error, expected variability, and sampling method.
- Random and stratified sampling improve representativeness; risk-based sampling prioritizes harm reduction.
- Recalculate whenever volume, scorecards, risk levels, or reporting goals shift.
- When manual sampling can't deliver enough coverage, broader automated analysis fills the gap.
How to Calculate Call Center Quality Monitoring Sample Size
A QA sample size calculator tells you how many calls to evaluate so your results estimate the full population within a defined level of uncertainty. The output depends on a few fixed inputs, not gut feel.
The Core Inputs
- Population size: total eligible recorded interactions in the review window (queue, team, campaign, or location)
- Confidence level: how sure you need to be that the sample reflects the full population (higher confidence means more calls)
- Margin of error: acceptable gap between the sample result and the true population result (tighter margins need larger samples)
- Expected proportion or variability: assumed rate for the outcome you measure (pass rate, critical-error rate), using historical data when available
- Sampling design: simple random sampling, finite population, or another structure the calculator assumes
The Formula (And What It Actually Produces)
For a binary outcome like pass/fail or "contains a critical error," NIST's formula is:
n0 = z² × p(1-p) / e²
Where z = 1.96 for 95% confidence, p is your expected proportion, and e is your margin of error. If you don't know p, use 0.5 — it produces the most conservative (largest) sample.
If your population is small relative to that result, apply a finite population correction:
n = n0 / [1 + (n0 - 1)/N]
Always round the result up to a whole interaction.
| Scenario | Confidence | Margin of Error | Population | Result |
|---|---|---|---|---|
| Large center, unknown p | 95% | ±5 points | Very large | 385 calls |
| Same target, defined pool | 95% | ±5 points | 1,000 calls | 278 calls |
| Looser precision accepted | 95% | ±10 points | Very large | 97 calls |
This finite population correction comes from Penn State's sampling theory materials. Use your real eligible population rather than an assumed infinite pool; the correction often cuts the required sample substantially.

Running the Calculation
- Define the review population and time period.
- Choose the primary outcome (pass rate, critical-error rate, compliance adherence, or a specific scorecard item).
- Set your confidence level and margin of error.
- Enter population and variability assumptions.
- Run the calculation and round up.
- Add an allowance for unusable recordings (duplicates, silent calls, or files that fail to pull) if your calculator does not already handle it.
Worked example: A hypothetical US contact center has 4,500 eligible calls in a month and wants to estimate its critical-error rate at 95% confidence with a ±5-point margin, assuming 50% variability. The finite population formula lands around 354 calls. Re-run the same inputs with your own population and historical error rate before you set a monitoring target.
What Affects the Required Sample Size?
The same contact center often needs different sample sizes depending on what question it's answering. Overall QA reporting, agent coaching, compliance auditing, and team comparisons are not the same statistical problem.
Rare events break simple samples. A sample designed to estimate an overall pass rate can easily miss infrequent but serious errors: a missed disclosure, a privacy violation, an escalation mishandled. If a critical failure only happens in 1% of calls, a random sample of 30 has roughly a 74% chance of catching zero instances.
That's not a flaw in the math; it's a mismatch between the tool and the question. High-risk interaction types usually need targeted review layered on top of random sampling.
Population characteristics shift the target. Watch for:
- Call-type variation across products, queues, or campaigns
- Channel mix (voice, SMS, email, chat)
- Seasonality that changes volume and call complexity
- Uneven volumes across agents: some handle 40 calls a week, others handle 400
Center-level samples don't translate to agent-level conclusions. This is the mistake that trips up most QA programs. A 385-call sample might comfortably estimate a centerwide rate within ±5 points. Divide that across 20 agents and each one gets roughly 19 calls, which is nowhere near enough for a confident, individual conclusion.
Reliable subgroup estimates require adequate samples within each subgroup, not a slice of the centerwide total. This is a standard principle in survey design methodology, not an EmberQA opinion. Plan agent-level and center-level samples as two separate calculations with two separate populations.
How to Choose a Representative Call Monitoring Sample
Calculating the right number means nothing if you pick the wrong calls. Selection method determines whether your sample actually represents what it claims to.
Comparing Sampling Methods
| Method | How it works | Best for |
|---|---|---|
| Simple random | Every eligible call has a equal chance of selection | Estimating aggregate, centerwide performance |
| Stratified | Divides calls by agent, queue, product, or risk category before sampling | Making sure smaller but important groups get represented |
| Systematic | Selects every nth call after a random start | Operational simplicity, but watch for periodic bias (same shift, same call type recurring) |
| Risk-based/targeted | Prioritizes complaints, escalations, regulated calls, or red flags | Risk management: answers a different question than representative sampling |
Most mature QA programs combine methods: random sampling for an unbiased baseline, plus targeted review for high-risk or low-frequency events.
In COPC's 2022 benchmarking report, 63% of surveyed executives said their QA programs randomly select monitored transactions. The rest still rely on other selection methods, so random sampling alone rarely describes the full QA mix.
Guarding Against Selection Bias
- Avoid letting supervisors hand-pick "interesting" calls for review
- Document every exclusion and why it happened
- Preserve the original sampling frame so it can be audited later
Allocating Across Agents and Groups
Decide upfront whether your goal is center-level estimation, fair agent coaching, client reporting, or team comparison. The allocation approach changes based on the answer.
- Proportional allocation reflects actual interaction volume per agent or queue.
- Minimum subgroup allocations guarantee enough calls per agent, but disclose it when a smaller group is being oversampled relative to volume.
None of this works without a stable scorecard, calibrated evaluators, and clear critical-error definitions applied consistently across every reviewer and team. When two evaluators score the same call differently, the sample size calculation becomes almost irrelevant.
How to Apply the Result in a Call Center QA Program
A calculator output is a number. Turning that number into a working QA program takes a bit more structure.
Build a review plan that specifies:
- Time period and eligible interactions
- Sample owner (who's responsible for pulling and assigning it)
- Selection method and scorecard version
- Exclusions and reporting level (center, team, or agent)
Schedule reviews across different days, shifts, queues, and call types so your sample doesn't accidentally represent a single operating condition (for example, only Monday morning calls or only one product line).
Track completion, not just the plan. Missing recordings, duplicates, scoring disputes, and post-selection exclusions all shrink your actual sample below the calculated target. If you planned for 300 calls and only 240 got scored, your margin of error just got wider than intended.
Get more out of the results than a single pass/fail score:
- Report confidence intervals alongside aggregate QA scores where it makes sense
- Break findings down by call type, agent group, risk category, and specific scorecard behaviors
- Separate coaching opportunities from critical compliance or customer-harm findings
- Compare QA results against customer feedback, first-contact resolution, and escalation patterns — without assuming correlation proves causation
Recalculate whenever your population, call mix, scorecard, confidence target, or risk environment changes. A sample size calculated for last quarter's call volume doesn't automatically hold up this quarter.

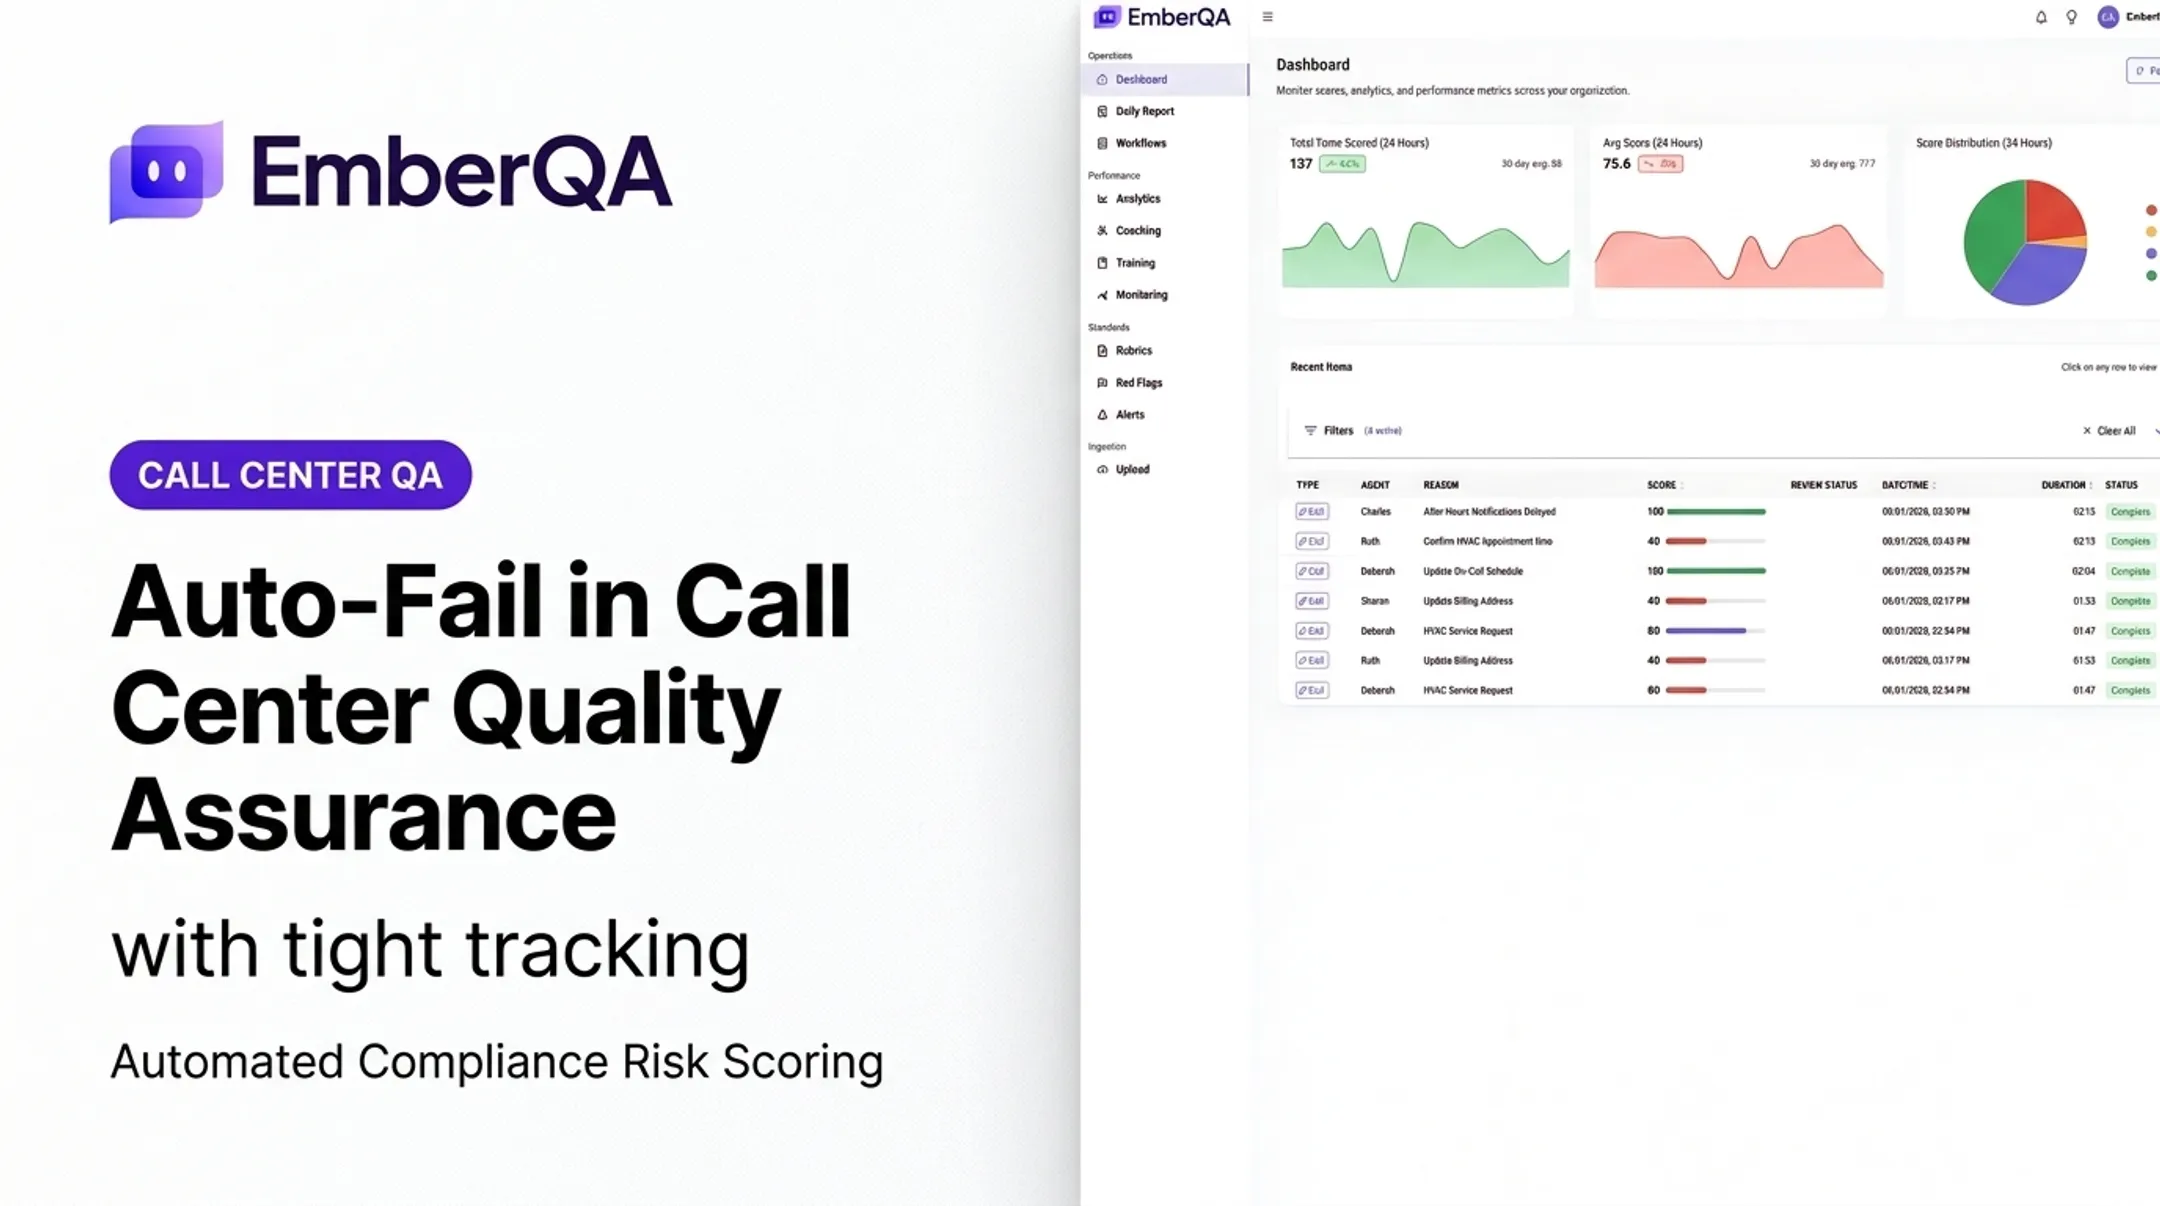
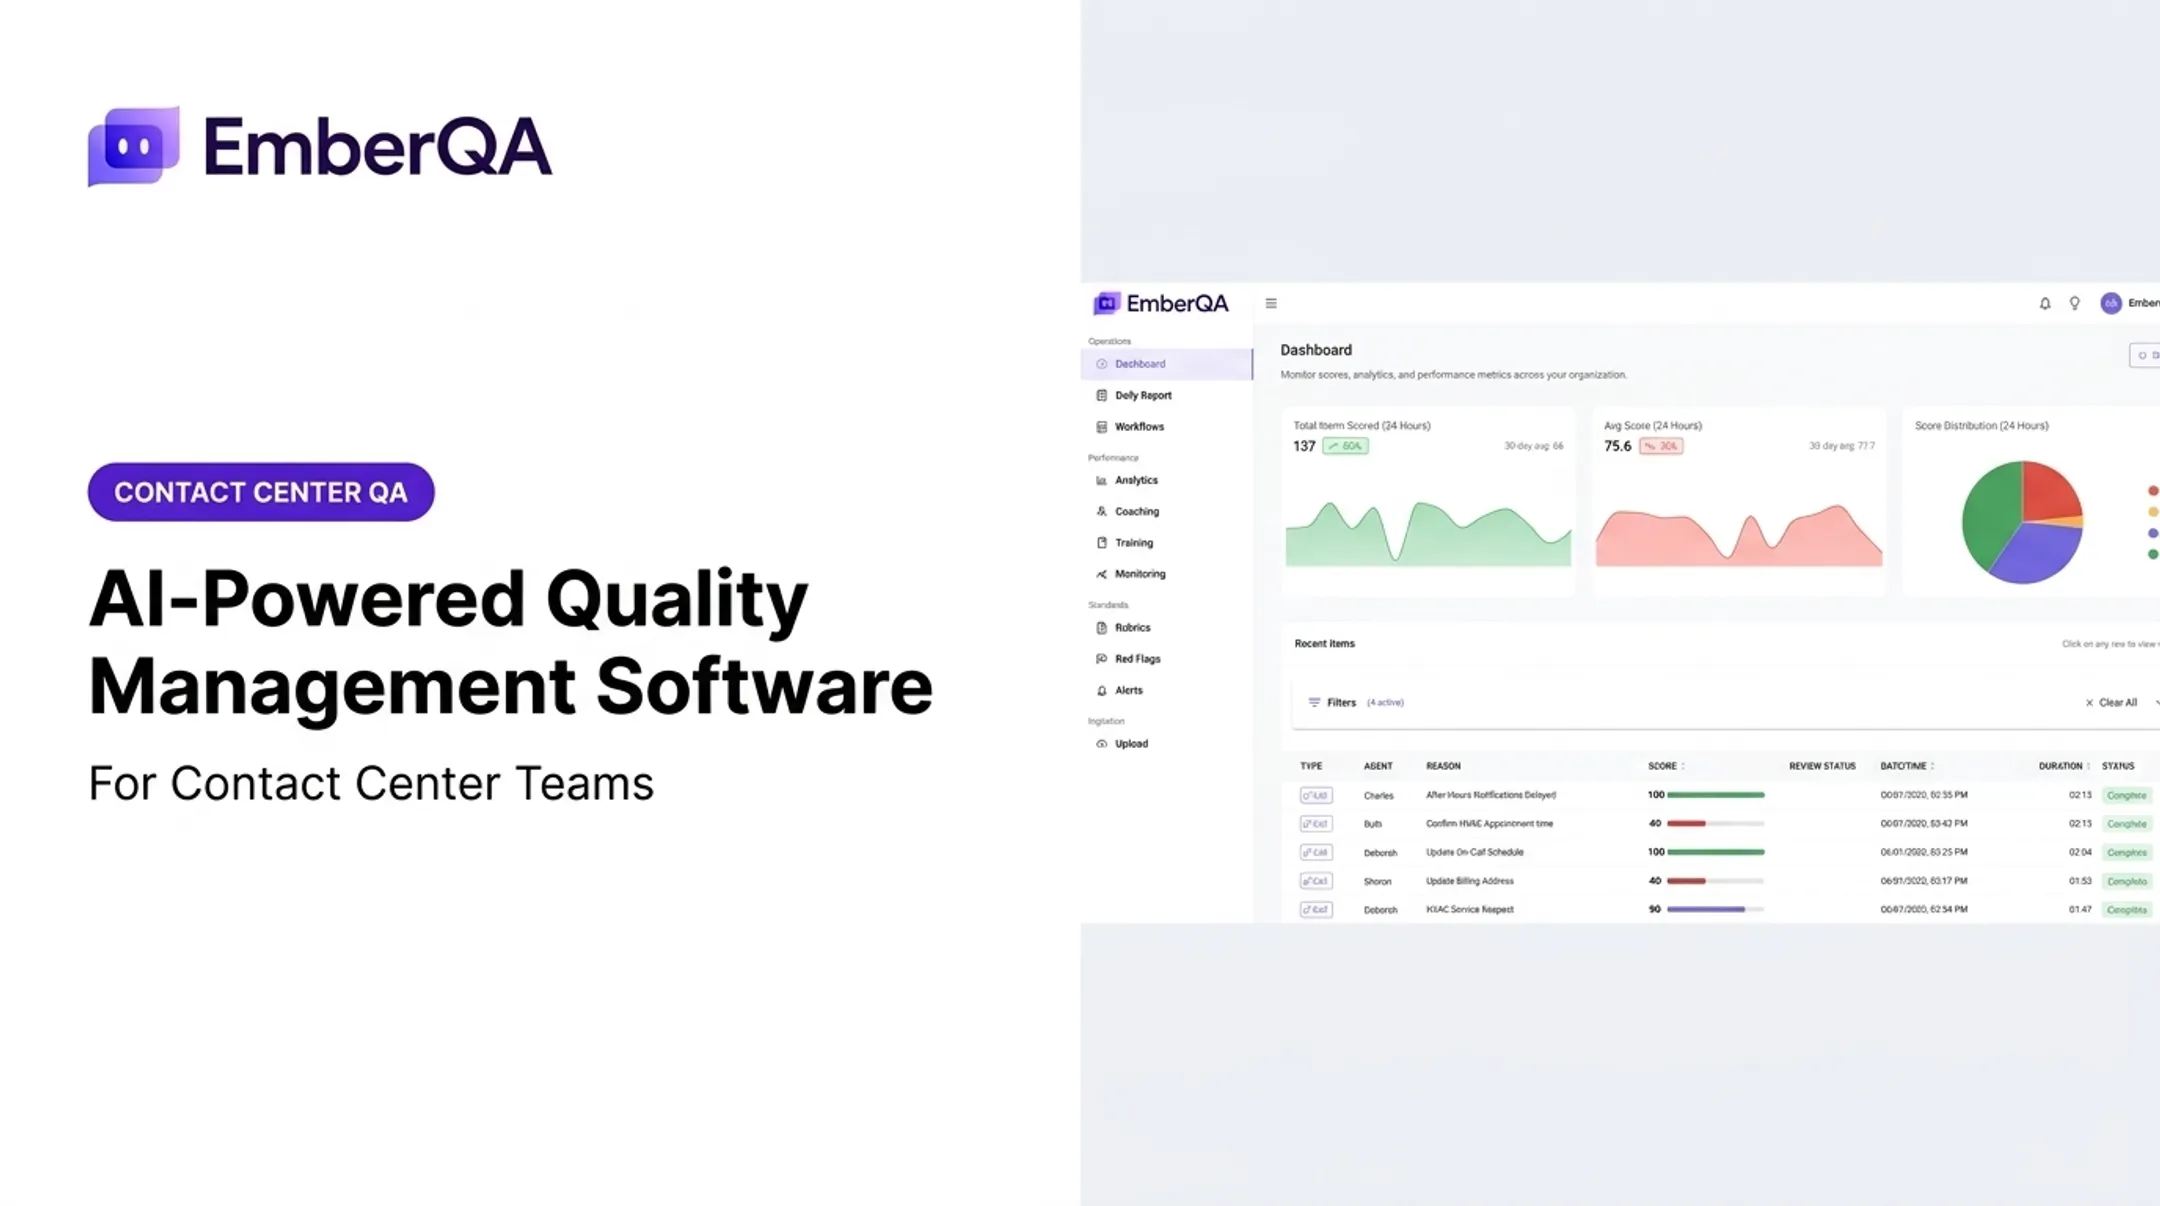
That drift is where manual sampling shows its limits. EmberQA's Automated QA Scoring evaluates every interaction against custom scorecards, rubrics, and weighted criteria instead of a random slice. Metric-level explanations tie back to the transcript and recording so reviewers can verify why a score landed where it did.
Interaction Analytics lets teams filter by agent, team, score, or missed metric. A monthly sampling exercise becomes an ongoing, searchable dataset.
When Sampling Is Not Enough
A properly calculated sample estimates population performance. It cannot guarantee you'll catch every critical interaction, individual issue, or rare compliance failure. That is a mathematical limitation, not a program failure.
Situations that typically justify expanded or comprehensive review:
- Regulated sales or claims calls
- Collections and debt-related interactions
- Complaints and high-value transactions
- New processes or major script changes
- Programs with recurring red flags
Manual sampling brings human judgment and focused calibration, but it's capped by evaluator capacity. ECA's experience is a good illustration: manual QA reviewed less than 1% of calls, and managers could only get through a handful of calls per agent each month. That ceiling is what manual review hits everywhere once call volume outpaces reviewer hours.
Automated QA changes the coverage math. EmberQA's platform analyzes 100% of supported customer interactions (calls, SMS, emails, and documents), applying the same rubric to each one.
Red-flag alerts surface hostile behavior, improper advice, privacy violations, and escalation risks for immediate review. That doesn't eliminate governance: scorecards still need validation, and edge cases still need human eyes. But it shifts QA from periodic snapshots to continuous visibility.

A practical decision rule:
- Use statistical sampling for defensible, centerwide estimation.
- Use targeted review for risk management on high-stakes call types.
- Use broader automated analysis when the business needs continuous visibility, not just a monthly report.
Frequently Asked Questions
How do I calculate the sample size for call center quality monitoring?
Define your population, confidence level, margin of error, and expected variability, then apply a proportion-based sample size formula. Align the calculation with your actual reporting objective: center-level, agent-level, and compliance goals each need separate math.
What sample size is needed for a 5% margin of error at 95% confidence?
It depends on your population size and expected variability, not a fixed number. As an illustrative example, a large population with unknown variability lands around 385 calls, while a defined population of 1,000 calls drops to roughly 278.
How do you measure quality in a call center?
Quality is measured against a defined scorecard covering customer experience, accuracy, process adherence, resolution, communication, and any applicable compliance requirements. Calibrated evaluators and relevant outcome data keep those scores consistent.
Why is 30 the minimum sample size?
It isn't a real minimum for QA. 30 is a rough teaching convention about when a sampling distribution of means starts approximating normal. The right sample size for call quality depends on your outcome, population, variability, and desired precision.
Should call center QA sample sizes be calculated per agent?
Yes, when agent-level conclusions matter. A center-level sample doesn't automatically support reliable per-agent findings, especially with uneven call volumes. Small agent samples should be labeled directional, not definitive.
Is random sampling better than reviewing every call?
Random sampling is well-suited for representative statistical estimates with limited reviewer time. Reviewing every interaction, where feasible, offers broader visibility and stronger red-flag detection. Choose based on risk level, available resources, and reporting needs.