Introduction
Most contact centers treat QA reporting as a dashboard you check once a week. That's a mistake. QA reporting is actually an end-to-end process: collecting interaction data, evaluating it against a scorecard, validating the findings, and turning them into decisions that get made and tracked.
For contact centers, BPOs, regulated service teams, and other customer-facing operations across the United States, this distinction matters. Compliance exposure, agent performance, and customer experience all depend on whether your QA data leads to action, not just whether it looks good in a chart.
Many teams struggle here:
- Manual sampling covers only a small slice of calls
- Scorecards get interpreted differently by different reviewers
- Reports pile up with no one assigned to fix what they reveal
This article breaks down how the process works, what affects its reliability, and where it tends to break down.
Key Takeaways
- QA reporting turns interaction evidence into coaching, risk, and compliance decisions.
- Strong reports combine scores with coverage, trends, severity, root cause, and customer impact.
- Executives need trend summaries; agents need specific coaching evidence from the same report set.
- Manual QA sampling often covers under 5% of interactions (McKinsey, 2024).
- EmberQA helps teams score every interaction consistently instead of small, hand-picked samples.
What Is the QA Reporting Process?
A QA report is a documented summary of interaction quality for a specific period: evaluation outcomes, risks identified, trends over time, and recommended next steps. Leaders use it to see what is actually happening in customer interactions and decide what to correct, reinforce, escalate, or measure again.
People often use "QA evaluation," "QA analytics," and "QA reporting" interchangeably. They're not the same thing.
- Evaluation scores a single interaction against a rubric: did the agent disclose required information, handle the objection correctly, follow the script?
- Analytics identifies patterns across many interactions: which teams are trending down, which failure types recur, where compliance risk clusters.
- Reporting takes those findings and communicates them to the right audience in a way they can act on.
Reporting Is a Process, Not an Export
A real QA reporting process has standards built in. It defines:
- How data gets collected
- How scoring gets validated
- Who interprets the findings
- Who receives which version of the report
- Who owns the follow-up
Exporting a spreadsheet or screenshotting a dashboard is data transfer, not reporting. Without validation, interpretation, and ownership attached, that data rarely changes anything. Teams that treat reporting as a process rather than a task tend to catch problems earlier and act on them faster.
Why QA Reporting Is Used in Contact Centers
Reporting creates visibility that a single average score can't provide. It shows how agent performance, customer experience, compliance exposure, and process consistency are trending across voice, chat, email, SMS, and any other channel a team supports.
Context matters more than the raw number. A 92% average score means very little on its own. Compare it against:
- Prior periods (is it improving or slipping?)
- Other teams, queues, or locations
- Different interaction types or channels
- Specific, high-stakes evaluation criteria (disclosures, escalations, hostile behavior)
Where Reporting Gets Used Operationally
Contact centers rely on QA reporting for several distinct purposes:
- Identifying coaching priorities based on recurring behaviors, not isolated mistakes
- Escalating urgent risks — a compliance red flag shouldn't sit in a weekly report
- Validating scorecard consistency across reviewers and teams
- Allocating QA resources to the queues or programs that need attention
- Improving scripts and knowledge bases based on where agents consistently struggle
- Supporting client or executive reviews, especially for BPOs reporting on client programs
What Happens Without It
Weak reporting has real consequences. The Consumer Financial Protection Bureau's 2024 supervisory review of auto finance servicers found recorded calls revealing undisclosed add-on products, paired with inadequate compliance monitoring of service providers. The interaction evidence existed. The monitoring process to catch it didn't.
That's the pattern behind most weak QA programs: inconsistent scoring, hidden compliance failures, generic coaching, and decisions made on incomplete samples.
One EmberQA customer, ECA, previously reviewed less than 1% of calls manually before moving to full interaction coverage. That low sample rate is a common starting point across the industry.
Reporting obligations vary by industry. Insurance, collections, and financial services often carry specific regulatory or contractual monitoring requirements. Verify what applies to your organization rather than assuming a universal standard.
How the QA Reporting Process Works
The process runs from defining objectives through closing the loop on action. Here's the full sequence.
Define the objective. Pick the audience, period, channels, programs, and questions the report needs to answer. Every report should connect to a decision: coaching, escalation, compliance review, staffing, or client communication.
Establish the scorecard and data inputs. This includes evaluation criteria, critical-failure rules, interaction metadata, reviewer notes, and any required compliance fields.
Collect representative evidence. Whether through manual sampling, automated evaluation, or a blend of both, document exclusions and coverage gaps clearly. A 10% sample and a 100% review aren't interchangeable, and the report should say which one you're working with.
Validate and calibrate. Check for data completeness, reviewer consistency, duplicate records, and disagreements between automated and human scoring before you trust the numbers.
Analyze beyond the average. Look at trends, severity, recurring behaviors, and differences between queues or teams. A flat average score can hide a serious spike in one specific failure type.
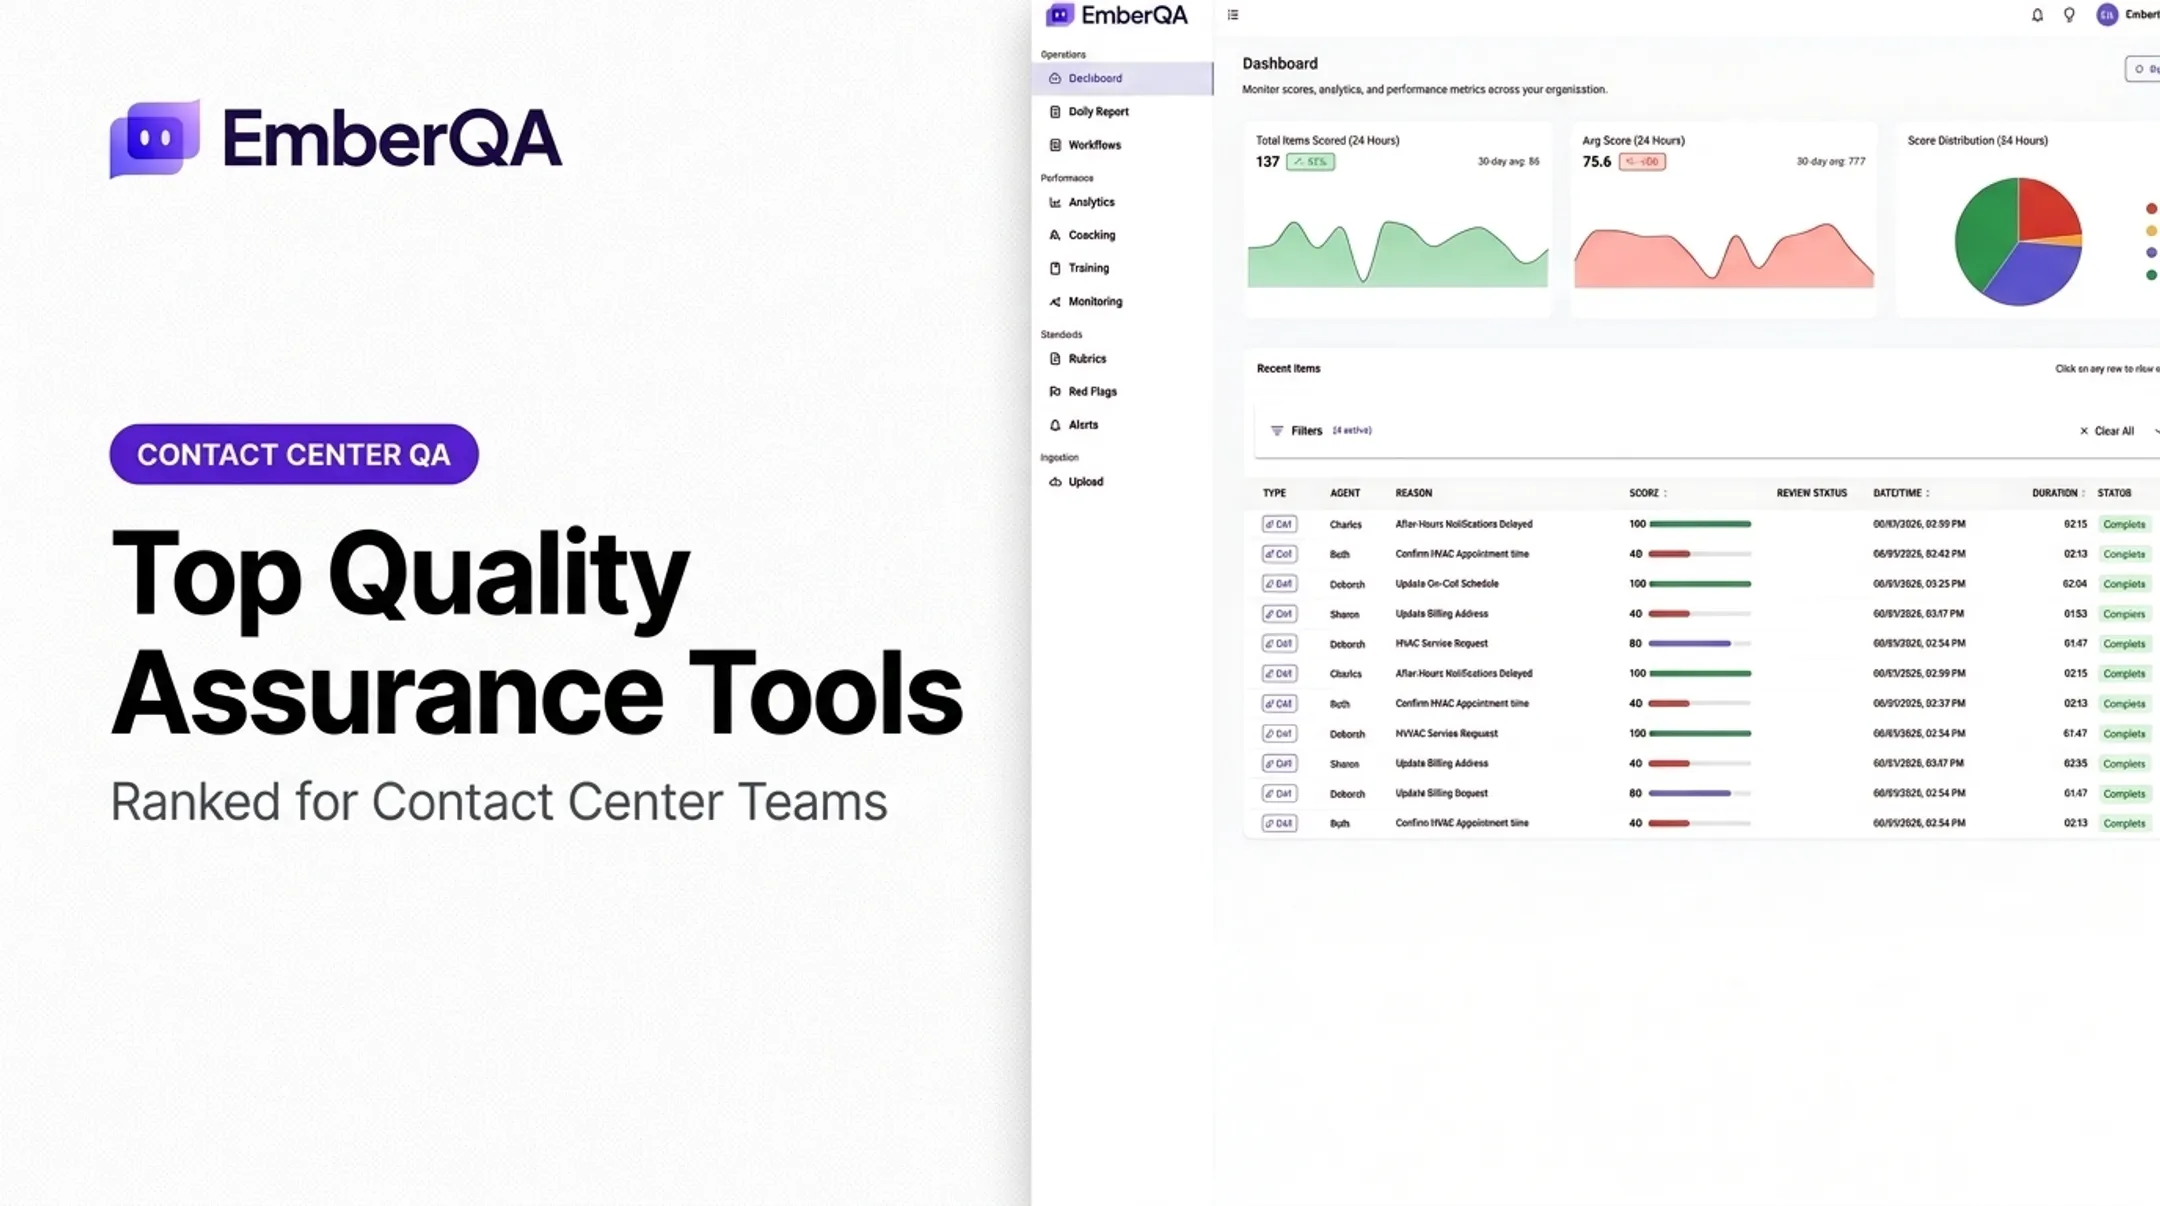
Build the report. Include an executive summary, key metrics, supporting evidence, interpretation, recommendations, owners, and due dates. Platforms like EmberQA score every interaction against custom scorecards, flag risks such as improper advice or privacy violations, and generate daily reports with coaching priorities.
Distribute the right version to each audience. Match depth to the reader:
- Executives: concise risk summaries
- QA leads: full criteria and evidence
- Supervisors: agent-level coaching detail
- BPO clients: program-level reporting tied to their contract
- Close the loop. Record the actions taken, monitor whether the issue actually improves, and use the next period's report to check whether the change worked.

Where QA Reporting Is Applied and What Affects It
QA reporting shows up across a wide range of customer-facing environments:
- Outsourced BPO programs and answering services
- Insurance carriers and agency call centers
- Financial services and collections operations
- Enterprise multi-site contact centers
- Sales teams and service desks
Reporting runs on recurring cycles (weekly, monthly, quarterly business reviews) and on triggers: post-incident analysis, new program launches, scorecard changes, or condition-based escalations tied to a compliance flag.
What a Complete Report Actually Contains
COPC's 2022 contact center QA benchmarking report found that 74% of organizations measured customer-critical, compliance-critical, and business-critical accuracy together. A single score rarely tells the whole story.
| Component | What It Covers |
|---|---|
| Coverage and volume | Interactions evaluated, channels included, manual vs. automated review, coverage gaps |
| Quality and risk | Overall and criterion-level scores, critical failures, red flags, trend direction |
| Customer context | Contact reasons, sentiment, repeat contacts, escalations, resolution outcomes |
| Coaching and ownership | Recurring behaviors, agents needing support, coaching completion, deadlines |
| Data governance | Recording quality, access permissions, retention rules, scorecard versioning |
A dental scheduling client, Spot On Schedulers, uses EmberQA to automatically review 100% of calls across 18 offices and verify CRM data alongside each interaction. That pairing of coverage and customer context shows how the components above work together in one report.
What those numbers mean still depends on how the report was built. These factors shift the picture:
- Sample size and channel mix
- Evaluator calibration
- Automation accuracy
- Metadata completeness and scorecard version consistency
Missing metadata or an inconsistent scorecard version between periods can make a trend look real when it is actually a measurement artifact. The safest structure separates evidence, interpretation, and action so nobody confuses a data point with a conclusion.

Common Issues and When QA Reporting May Not Be Appropriate
A few misconceptions cause more damage than most people realize:
- "A high average score means every interaction is healthy." It doesn't. One critical failure can hide inside a strong average.
- "More evaluations automatically mean better QA." Volume without calibration just produces more noise.
- "A dashboard is the same as a reporting process." A dashboard shows numbers. A process assigns meaning and ownership to them.
- "More defects always means performance worsened." Sometimes it means you finally started measuring the right thing.
Failures Worth Watching For
Common breakdowns include:
- Vanity metrics
- Disconnected data sources
- Uncalibrated reviewers
- No trend comparison
- Recommendations without an assigned owner or deadline (often the most damaging)
Some situations call for delaying or qualifying a report rather than publishing it as-is:
- Recordings are incomplete or unverifiable
- The scorecard changed mid-period
- Automated findings haven't been validated yet
- Privacy or access requirements haven't been addressed
And sometimes reporting isn't even the right tool:
- An urgent incident calls for a focused review, not a scheduled report
- Scoring disagreements call for a calibration session
- A recurring process failure calls for root-cause analysis

If stakeholders can't say what decision a report supports, or nobody acts on the same finding twice, reporting is happening by default rather than by need.
Conclusion
QA reporting works when you treat it as a repeatable process. Accurate data goes in, relevant measures get applied, the right detail reaches the right audience, and findings drive real follow-through.
When manual review limits how much of your interaction volume gets seen, an AI-powered platform can close that gap. EmberQA connects scoring, red flag detection, and reporting into one system so teams can move from partial samples to full interaction coverage without adding manager workload.
Frequently Asked Questions
What is a QA report?
A QA report is a structured summary of quality findings for a defined period and audience. It includes evaluation scores, supporting evidence, trends, identified risks, and recommended next steps.
What are the 5 qualities of a good report?
Strong reports are accurate, clear, relevant, consistent, and actionable. The U.S. GAO frames its standard as timely, accurate, useful, clear, and candid, a useful benchmark even outside government reporting.
What are the top 3 skills for a QA analyst?
Analytical judgment to spot trends, close attention to detail when scoring against a rubric, and strong communication skills to deliver coaching feedback that agents actually use. These three show up consistently in QA analyst job postings.
What are the 5 P's of quality assurance?
No single "5 P's" framework is universally recognized in QA. Some teams use People, Process, Procedures, Product, and Practice as informal scope shorthand. ISO lists seven quality management principles, including customer focus and evidence-based decision-making.